Metrics
Under SambaBox directory management, there are metrics that will be useful for system administrators. These metrics provide important information about the health and performance of the system.
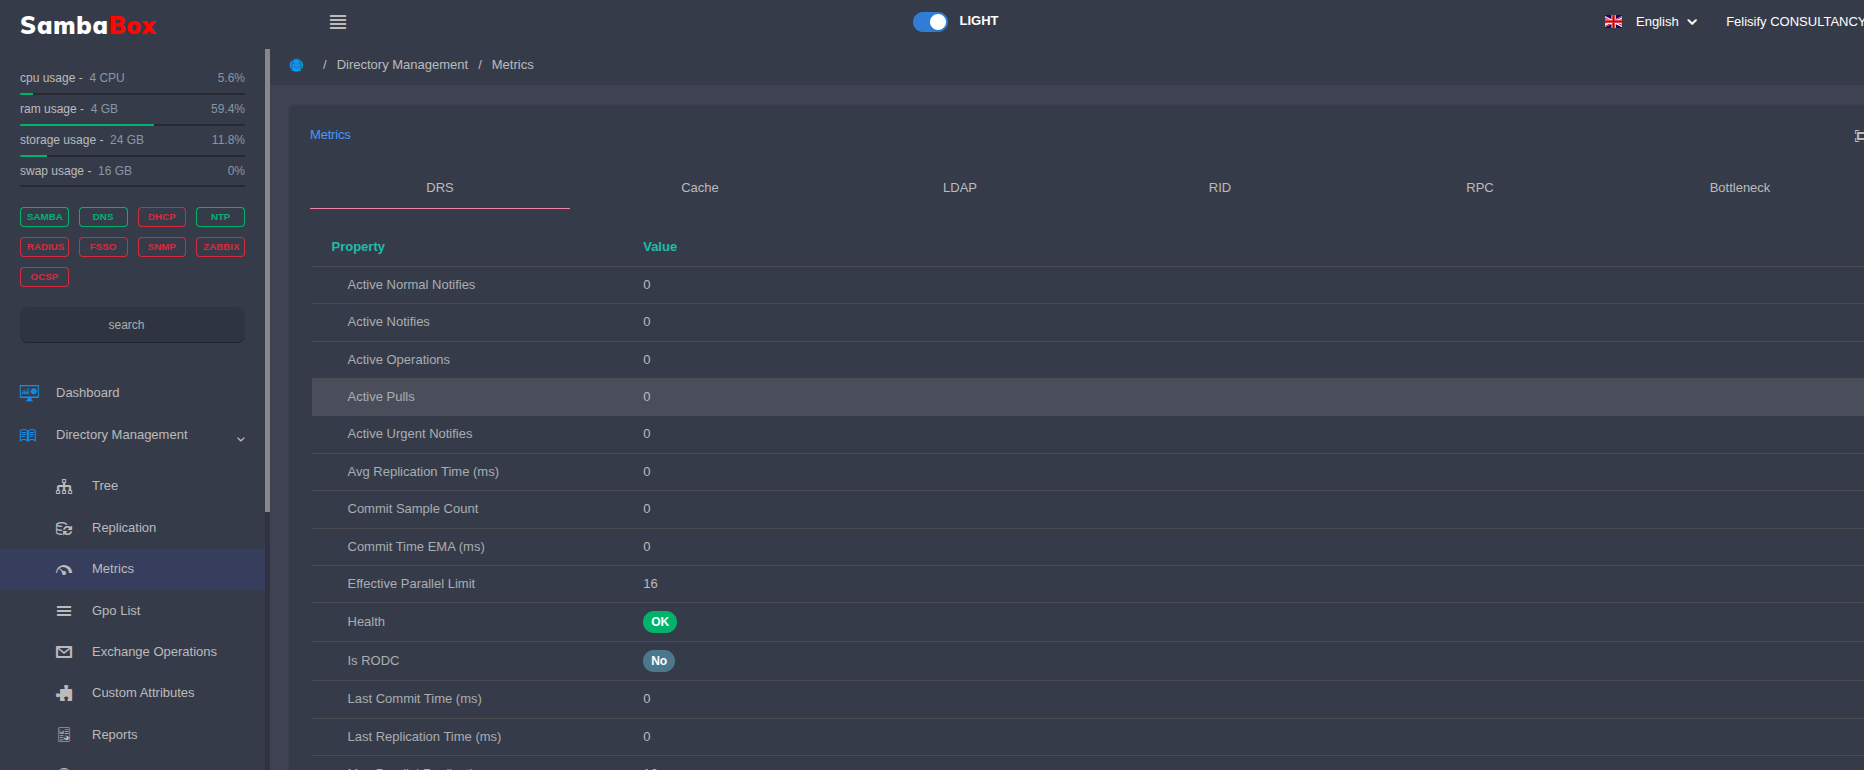
DRS
Displays Directory Replication Service (DRS) metrics. DRS is the core service that ensures data synchronization between domain controllers. It is responsible for keeping copies of users, groups, and other directory objects up-to-date across all servers.
Note
Metrics: Active Normal Notifies, Notifies, Active Operations, Active Pulls, Active Urgent Notifies, Average Replication Duration (ms), Commit Sample Count, Commit Duration EMA (ms), Effective Parallel Limit, Health Status, RODC Count, Last Commit Duration (ms), Last Replication Duration (ms), Max Parallel Async, Max Parallel ACI, Normal Notifications, Non-Urgent Pauses, Pending Pulls, Pending Total, Replication Halted, Saturation Ratio, Service Runtime (seconds), Stall Reasons, Suspected Scheduler Stall, Total Replica Links, Total Replicated Objects, Total Replication Failures, Total Successful Replications, Urgent Modification Notifications, Urgent Notifications
Cache
Displays metrics related to system cache usage.
Note
Metrics: Enabled, Entries, Evictions, External Enabled, External Hit Rate Pct, External Hits Negative, External Hits Positive, External Hits Total, External Lookups, External Misses, External Stores Negative, External Stores Positive, External Stores Total, Generation, Health Status, Health Sections, Hit Rate Pct, Hits Negative, Hits Positive, Hits Total, Internal Enabled, Invalidations, Ldap Search Read Cache Enabled, Ldap Search Read Cache Entries, Ldap Search Read Cache Evictions, Ldap Search Read Cache Generation, Ldap Search Read Cache Hit Rate Pct, Ldap Search Read Cache Hits, Ldap Search Read Cache Invalidations, Ldap Search Read Cache Lookups, Ldap Search Read Cache Misses, Ldap Search Read Cache Stores, Lookups, Max Entries, Misses, Stores Negative, Stores Positive, Stores Total, Ttl Negative, Ttl Positive
LDAP
Displays statistics of operations performed over the LDAP protocol.
Note
Metrics: Buckets, Add, Del, Modify, Queue Wait, Queue Wait Bind, Queue Wait Read, Queue Wait Write, Sasl Local, Sasl Offload, Search, Simple Local, Simple Offload, Tls Accept, Error Breakdown, Bind, Health Status, Fail Rate, P95 Max Ms, Pending Calls, Verdict, Write Queue Max Pending, Write Queue Pending, Per Source, Unix, Queue Depth, Bind Pending Calls, Open Connections, Search Read Cache Enabled, Search Read Cache Entries, Search Read Cache Evictions, Search Read Cache Generation, Search Read Cache Hits, Search Read Cache Invalidations, Search Read Cache Lookups, Search Read Cache Misses, Search Read Cache Stores
RID
Displays RID (Relative Identifier) pool usage and status. Every directory object (user, group, etc.) must have a unique Security Identifier (SID). The RID is the final part of this SID and ensures uniqueness within the domain. RID pool management is critical to prevent identity conflicts when creating new objects.
Note
Metrics: Health Status, Rid Manager Available Count, Rid Manager Available End, Rid Manager Available Pool, Rid Manager Available Start, Rid Manager Dn, Rid Manager Headroom Pct, Rid Set Count, Rid Set Crit Count, Rid Set Warn Count, Rid Sets, Allocation End, Allocation Pool, Allocation Size, Allocation Start, Current Pool Consumed, Current Pool End, Current Pool Remaining, Current Pool Size, Current Pool Source, Current Pool Start, Current Pool Utilization Pct, Dc Name, Dn, Health Reason, Last Allocated Rid, Next Rid, Previous End, Previous Pool, Previous Size, Previous Start
RPC
Displays Remote Procedure Call (RPC) statistics. RPC is a protocol that allows a program to call a service on another computer in the network as if it were local. Many administrative operations and replication traffic within SambaBox occur over this protocol.
Note
Metrics: Fault Codes: Interfaces: Dnsserver: Epmapper, Lsarpc, Samr, Latency: Count, Fail, Max Usecs, Min Usecs, P50 Usecs, P95 Usecs, Success, Total Usecs, Opnum: Summary: Active Calls, Active Connections, Calls Fault, Calls Success, Calls Total, Peak Active Calls, Peak Active Connections
Bottleneck
Displays potential bottleneck points and performance constraints in the system.
Note
Metrics: Health Status: Ldap Expensive Ops: Expensive Operations, Health Status, Note, Query Fingerprints Supported, Top Operations, Ldb Tdb Contention Proxy: Contention Score, Drs Pending Total, Health Status, Ldap Queue Wait Avg Ms, Ldap Queue Wait P95 Ms, Ldap Queue Wait Samples, Note, Rpc Active Calls, Rpc Active Connections, Rpc Peak Active Calls, Rpc Peak Active Connections, Recommendations: Action, Area, Capacity, Commands, Priority, Replication Drift: Avg Last Success Age Seconds, Failing Neighbor Count, Health Status, Highwatermark Highest Usn Max, Highwatermark Highest Usn Min, Highwatermark Highest Usn Spread, Max Consecutive Failures, Max Last Success Age Seconds, Neighbor Count, Stalest Neighbors: Unknown Last Success Count, Runtime Saturation: Drs Saturation, Health Status, Ldap Bind Pending Calls, Ldap Pending Calls, Ldap Queue Pressure, Ldap Write Queue Max Pending, Ldap Write Queue Pending, Ldap Write Queue Pressure, Overall Saturation Ratio, Rpc Call Saturation, Rpc Connection Saturation, Sections Requested: Slo Baseline: Drs Error Rate, Drs Pending Total, Drs Saturation Ratio, Ldap Fail Rate, Ldap Queue Wait P95 Ms, Rpc Fault Rate, Rpc P95 Ms, Sources: Drs Metrics, Ldap Metrics, Rpc Metrics, Samdb Repsfrom, Samdb Tombstone, Tombstone Lingering Risk: Health Status, Max Replication Gap Days, Max Replication Gap Seconds, Tombstone Lifetime Days, Tombstone Risk Pct, Tombstone Risk Ratio